Earth observation on your desktop
Pick an area on a map, fill in a short form and press Run. Hiri finds the satellite imagery and elevation data it needs, so there is nothing to download or reproject first. Analyses run on your machine and nothing is uploaded.
Download
Download for Windows- Requirements
- Windows 10 or 11 on x64. It installs per user, so no administrator rights are needed. Nothing else to install: the analysis runtime is bundled with the app.
- Not built
- There is no Linux build. It is untested rather than impossible.
Burn severity
- Reading the pre-fire period
- Reading the post-fire period
- Differencing the two periods
- Classifying severity
- Building the severity map
- Severity comes from dNBR thresholds published by Key and Benson (2006) for Landsat over North American forest. They are not calibrated for Sentinel-2 or for any particular vegetation type.
- dNBR assumes fire is the only thing that changed between the two dates. Harvest, drought and deciduous leaf-off raise it the same way.
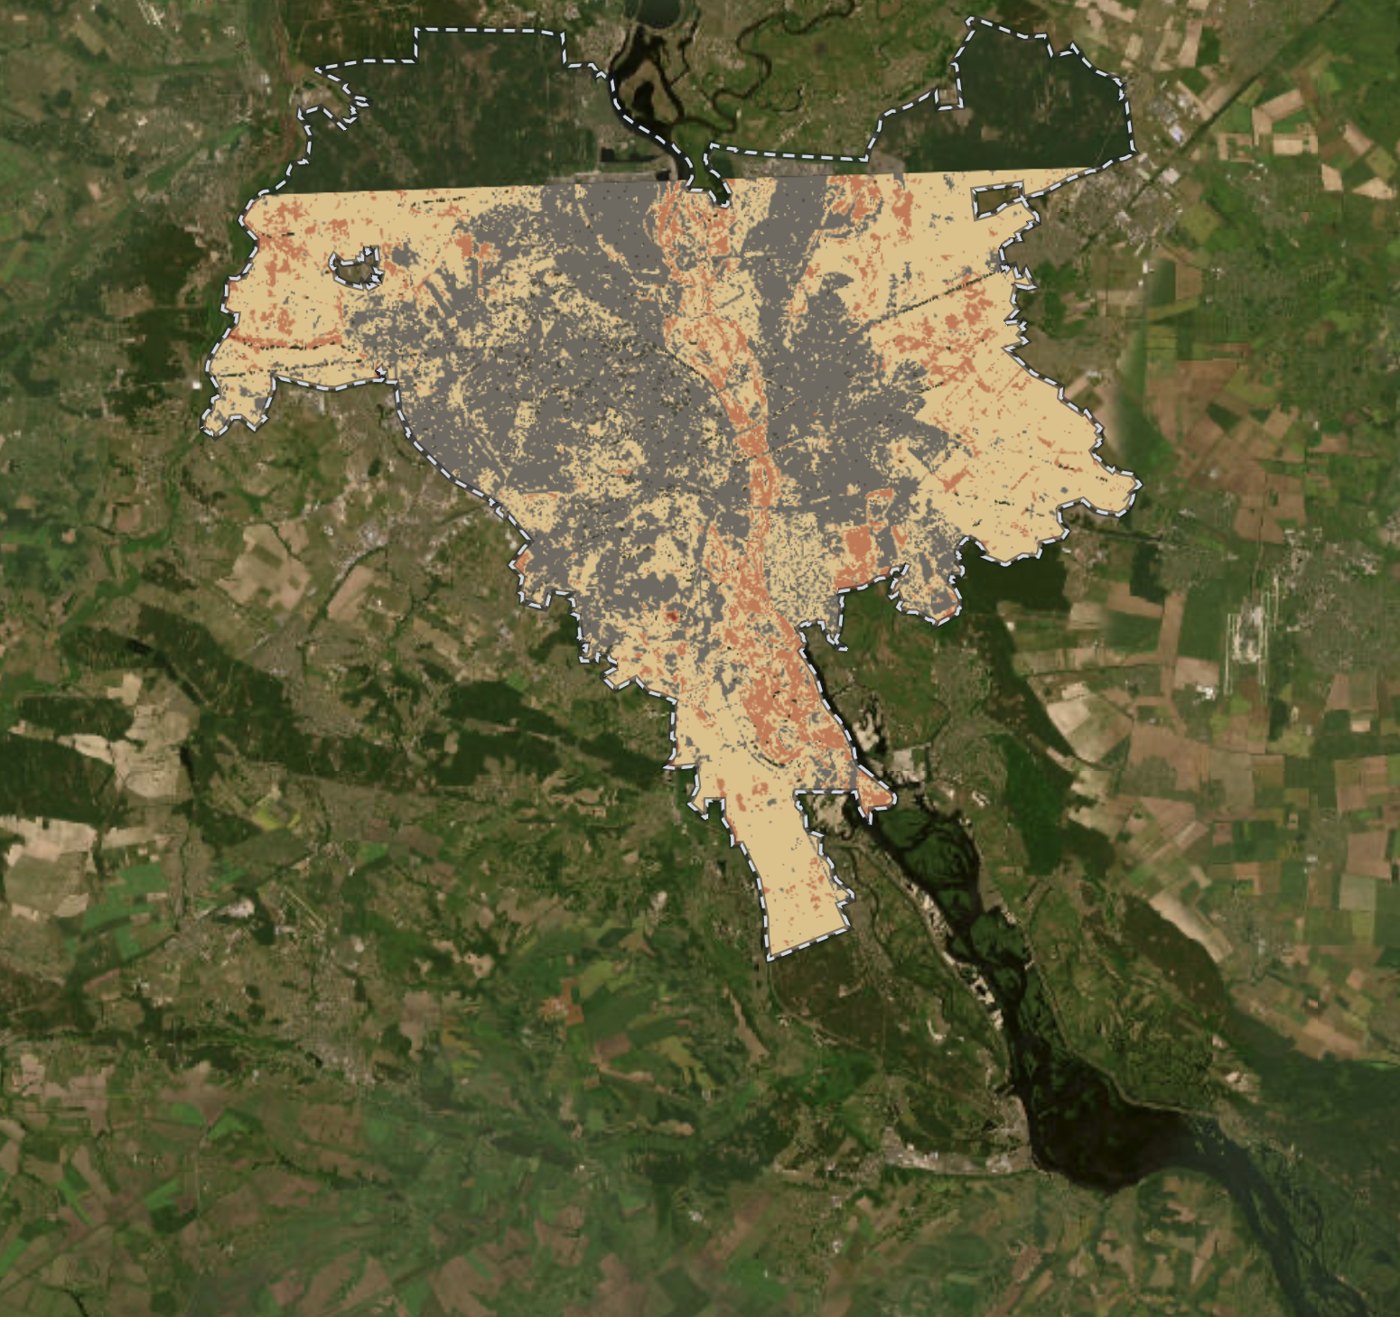
Nine questions it answers for you
Each guided analysis answers one question from an area and a date window. One screen serves both audiences: a short form with working defaults, and an Advanced section holding every threshold and weight behind the result.
Land
- Urban growth
- Where built-up land was gained or lost between two dates, in hectares
- Green space
- Vegetation extent, or how it changed between two dates
- Land cover
- Water, vegetation, built-up and bare soil, by index thresholds or K-Means, and how far it agrees with ESA's published map
- Growing season
- Start, peak, end, length and productivity, per pixel, over a year
- Vegetation indices
- NDVI, NDRE, RECI, MNDWI, NDBI or NBR as a continuous surface
- NDVI for one image
- NDVI for a scene you picked by name
Water
- Water
- Surface water extent, or how it changed, before and after a flood
Climate and hazards
- Burn severity
- Fire severity in four classes, against the published dNBR thresholds
Terrain
- Terrain
- Elevation, slope, aspect and hillshade. Bare-earth and about 10 m where United States coverage reaches, 30 m elsewhere
Imagery and elevation, fetched at run time
Sentinel-2 L2A
Imagery through a public STAC API, read with windowed and overview reads, so a whole scene is never downloaded.
Elevation
USGS 3DEP at about 10 m and bare earth across the United States, Copernicus DEM GLO-30 at 30 m elsewhere. Hiri picks one and names it in the result, because only one of the two includes buildings and tree canopy in its heights.
ESA WorldCover
A published 10 m land cover map in eleven classes, added as a layer to compare your own classification against. Hiri fetches it rather than computing it.
Boundaries and place search
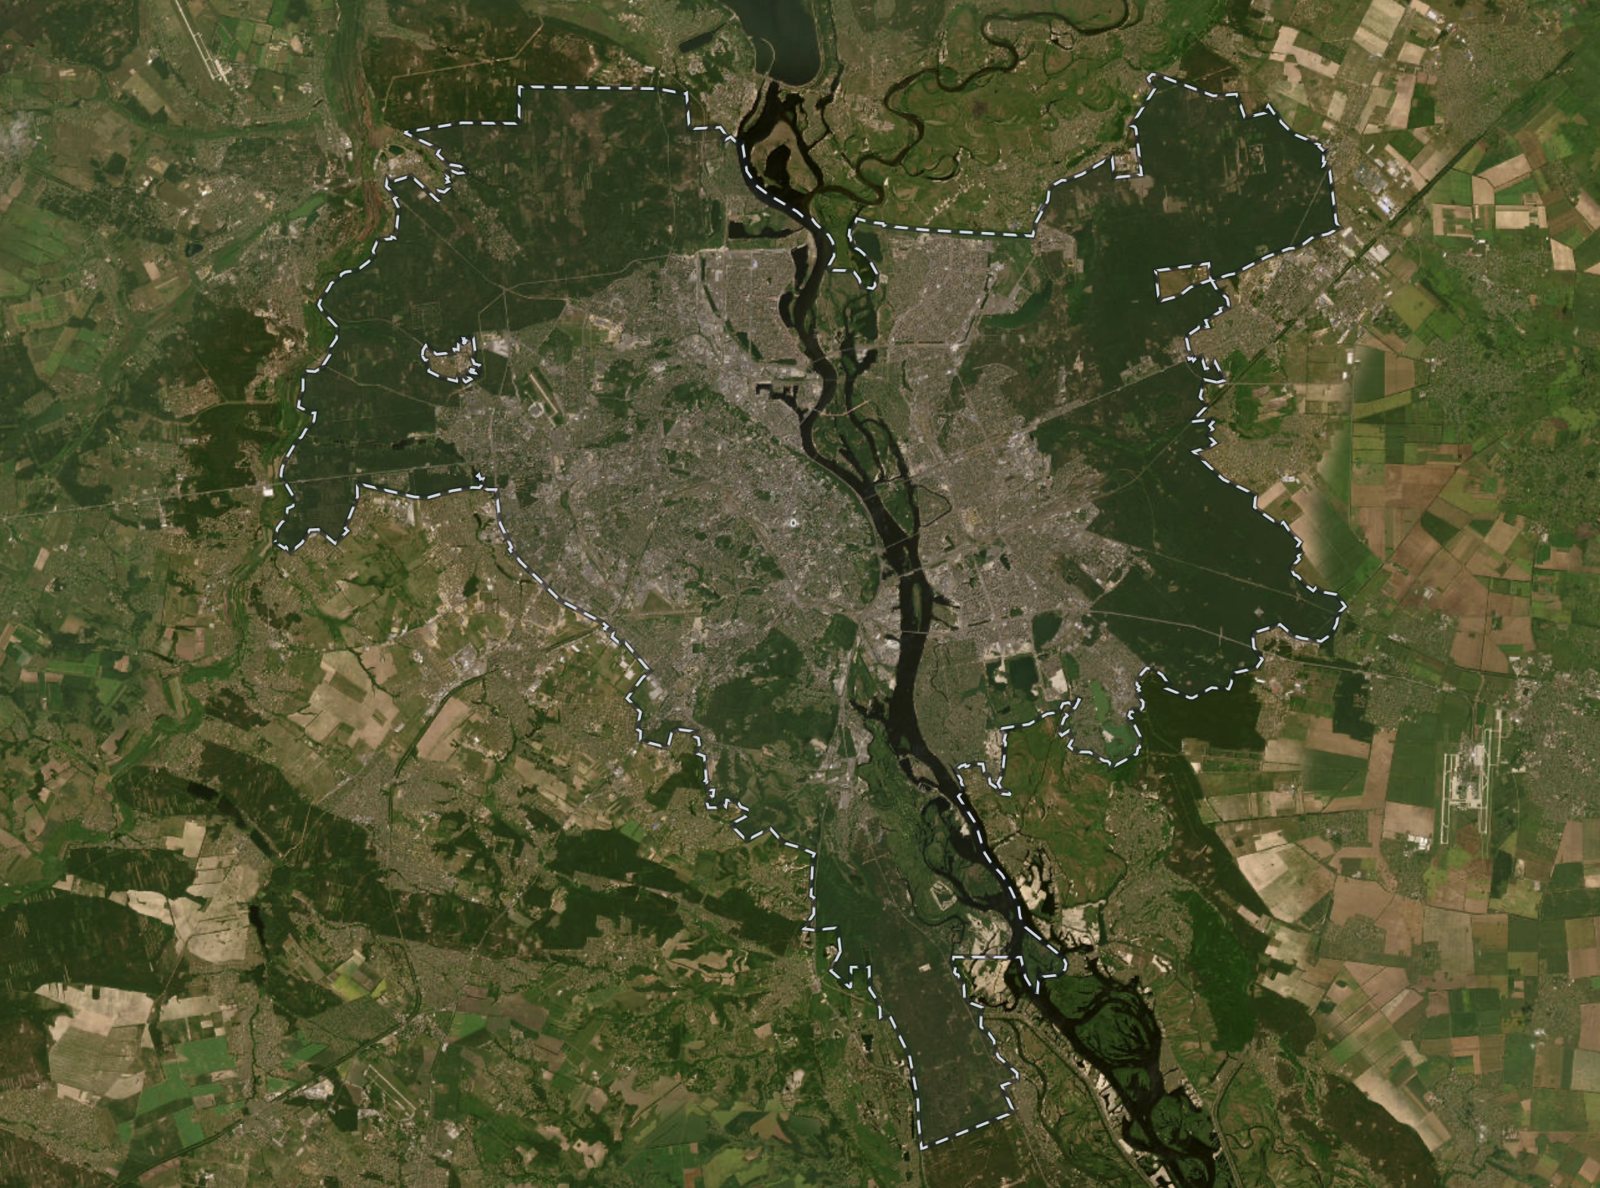
An analysis can be cropped to the municipality you named rather than a rectangle around it.
Your own raster
Imported as a layer once it passes validation.
 Kyiv
Fifteen raster operations, for the steps in between
For what the nine analyses do not cover. They apply to any layer, including a GeoTIFF you imported.
Derive
- Compute an index from bands you map
- Combine up to four layers by weight
Classify
- Threshold to a mask
- Reclassify by ranges
- Group similar pixels (K-Means)
- Majority filter
- Number connected patches
- Trace to polygons
Compare
- Difference two layers
Spatial statistics
- Zonal statistics per class
- Neighbourhood statistics
- Clusters and outliers (local Moran's I)
Terrain and water
- Cut and fill volumes
- Flow direction (D8)
- Flow accumulation
Formats your other tools open
Charts are drawn from the run's own numbers and coloured to match the map. Projects save and reopen with their layers, opacity, legends and past runs. Long jobs stream progress and cancel cleanly.
- Layers, for QGIS and ArcGIS
- GeoTIFF · GeoJSON
- Statistics, for spreadsheets
- CSV · JSON
- Charts, for a document
- PNG 1–4× · SVG
- The map itself
- PNG
What each result does not tell you
Every analysis reports its limitations next to its numbers, along with the parameters and source scenes that produced them.
Two examples
- Urban growth uses a spectral index that cannot distinguish built surfaces from bare soil, so growth is overstated where ground has been cleared but not yet built on.
- Elevation comes from one of two models. Only one of them includes buildings and tree canopy in its heights, so the result names which one covered your area.
What it does not do
- Not a GIS. No editing, digitising, topology, cartography or print layouts. Hiri produces layers and numbers to take into QGIS or ArcGIS.
- No vector or network analysis: no routing, isochrones or travel-time catchments.
- No offline operation and no telemetry.
Hiri Desktop is free, with no limit on what you run
For Windows 10 and 11. The macOS version is not released yet.